11 user engagement metrics you should be looking at
Businesses face a big problem when it comes to understanding how interested potential customers are in their products and services. The typical B2B buyer’s journey is long and convoluted, making it hard to know where users are in the process.
By tracking user engagement metrics, businesses can be better equipped to determine where customers are in the buyer’s journey and get a better idea of how interested prospects are.
With so many metrics out there, it can be tough to know which ones to track.
With this in mind, we’ve compiled a list of 11 metrics for measuring user engagement in 2022. To begin, let’s discuss what user engagement is and why it’s important.
Jump to:
- What is User Engagement & How Do You Measure it?
- Why User Engagement Metrics Are so Important
- 11 User Engagement Metrics You Should Be Tracking in 2023
What is user engagement, and how do you measure it?
User engagement is the level of interaction that a user has with a product, service, or brand. It’s often used as a metric to gauge how well a company is meeting the needs of its customers, or how satisfied they are with the experience.
A high level of engagement typically indicates that users are happy and loyal, while a low level often points to problems that need to be addressed. There are a number of ways to measure user engagement, including retention rates, satisfaction scores, social engagements, and more.
Customer engagement may be familiar to you, but it’s actually quite different from user engagement.
User engagement focuses on the interactions between the user and the product, while customer engagement encompasses the relationship between the customer and the company.
Why user engagement metrics are so important
There are a number of reasons why user engagement metrics are so important.
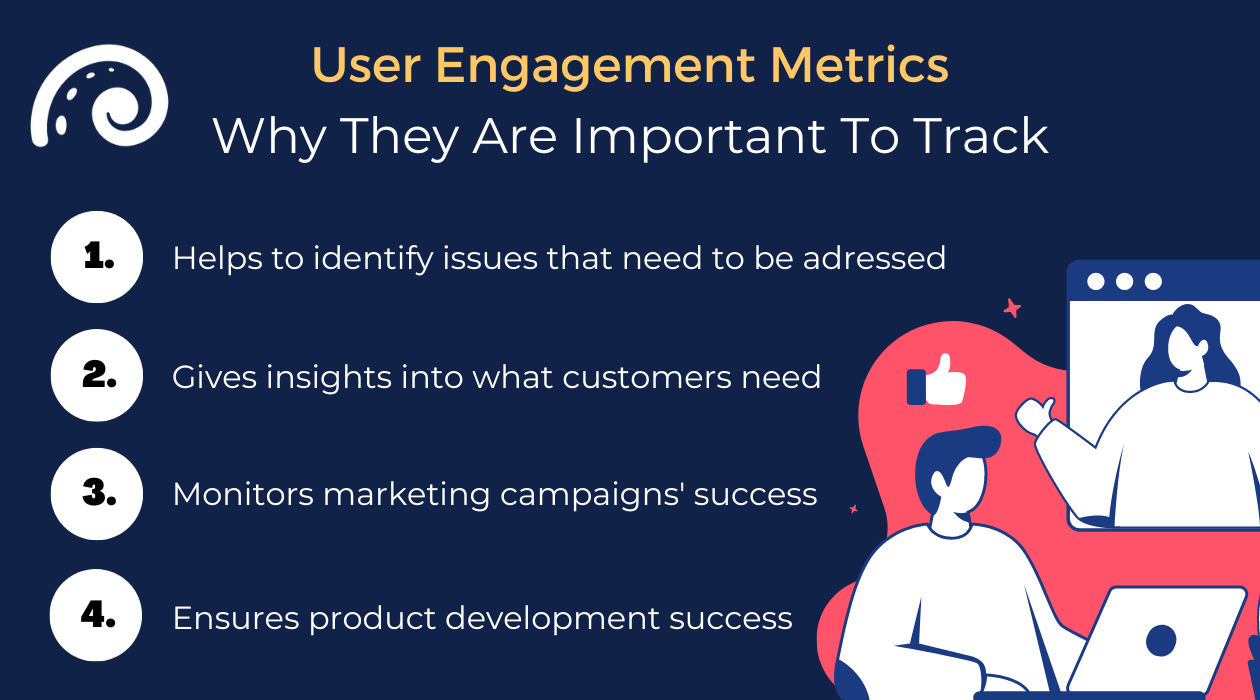
Some benefits of understanding user engagement metrics are:
- Helps you identify issues that need to be addressed.
- Gives you insights into what users want and need.
- Allows you to identify pain points and areas of improvement in the user experience.
- Helps you make decisions about product development.
- Measures the success of marketing campaigns.

On top of that, user engagement metrics can be used to track customer satisfaction. If you notice that a particular metric is declining, it could be an indication that customers are becoming dissatisfied with your product or service.
Recommended for further reading
12 User engagement metrics you should be looking at
Among the endless metrics you could look at and get lost in, we have listed 12 user metrics that actually matter. Through them, you can gain valuable insights that will help you improve your business.
1. Social engagement metrics
Social engagement metrics provide valuable insights into how customers interact with your brand on social media.
There are a number of ways to measure social engagement; some businesses track the number of likes, shares, and comments on their posts, while others focus on click-through rates or time spent on site.
Overall, some of the most important ones are:
- Audience growth rate
- The number of likes, comments, and shares your posts receives
- Social media engagement rate
- Customer response rate
- Traffic to your website
Furthermore, your engagement rate is another important metric in terms of social engagement. Engagement rate is calculated by dividing the number of people who interact with your content by the number of people who see it. You can track your engagement rate and determine how well your content is doing.
Your engagement rate will ultimately depend on what’s normal for your company and advocacy posts.

Social engagement metrics should be imported into CRMs and analytic tools such as Oktopost for further analysis. Oktopost’s social media management platform offers social engagement insights that help you better understand your customers.
It’s important to note the way you calculate the social engagement rate. The benchmark graph is based on the amount of engagement versus the number of total followers. Other social media tools might measure engagement based on the number of impressions from the individual post.
If you notice that your engagement rate is low, it could indicate that your content is irrelevant to your target audience or that it’s not interesting enough.
Focus on creating high-quality, relevant, and interesting content to improve your engagement rate.
2. Users: DAU, WAU, & MAU (also bonus metric: Stickiness)
There are three different ways to measure how often users are logging into your app or website:
- DAU: daily active users
- WAU: weekly active users
- MAU: monthly active users
DAU is a good metric to track if you want to see how often users are using your product daily. WAU and MAU are good metrics to track if you want to see how often users are using your product weekly or monthly.
The bonus metric, stickiness, is the ratio of DAU to MAU. This metric gives you an idea of how often users are using your product on a daily basis relative to how often they use it on a monthly basis.
3. Churn rate
The churn rate is the percentage of customers who stop doing business with a company during a given period.
It’s a key metric for businesses because it directly affects revenue. A high churn rate means that a company is losing more customers than it’s gaining, and that eventually leads to a decline in revenue. A low churn rate, on the other hand, indicates customer satisfaction and loyalty.
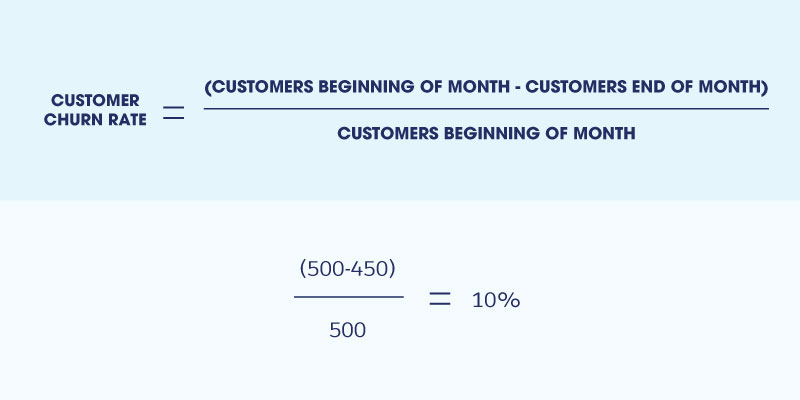
Churn rate is fairly easy to calculate:
For example, your company has 1000 monthly paying customers at the beginning of the month. Then, 100 customers cancel their subscriptions during the month.
This means that your churn rate would be 10%.
4. Retention rate
The retention rate refers to the percentage of customers who remain active in a given period and are still customers in the next period. The retention rate is an important metric for businesses to track, as it provides insight into how well the business is retaining its customers.
To calculate your retention rate, divide the number of active users in a given period by the number of active users in the previous period.
5. Page views
The number of page views measures how many times a user has viewed a particular page on your website.
Tracking page views gives you an idea of which pages on your website are being viewed the most. If you notice that a particular page has a high number of page views, it may indicate that users find the page useful.
On the other hand, if you notice that a particular page has a low number of page views, it may mean that the page is not relevant to your target audience or that it’s not interesting enough.
6. Session length
The session length is the amount of time that a user spends on your website or app in a single visit.
It’s important to track because it can give you insights into how engaged users are with your content. If the average session length is short, it could mean that users are not finding what they’re looking for or that the content is not relevant to them.
In contrast, if your average session length is too long, your users might have difficulty navigating your site or app. Use this metric with the context of other metrics, like bounce rate and exit pages, to better understand where your sweet spot is.
7. Session frequency
In simple terms, session frequency refers to the amount of time that passes between two consecutive sessions.
When analyzing session frequency, look for trends. For example, is there a particular day of the week when users are more likely to return? Is there a particular time of day when users are more likely to return?
Ask yourself why users might be returning more or less often. If you can identify the reason, you can take steps to improve the user experience and keep users coming back.
8. Time in-app
In-app time tracking allows you to see how long a user spends in your app over a period of time.
For example, you can see that user X was in your app for three of the last 24 hours.
This is a valuable metric for understanding how often your app is being used and how engaged your users are with the app experience. By tracking in-app time, you can identify which areas of your app are most popular and make changes to improve the overall user experience.
9. Screen flow
The screen flow metric provides an analysis of the total number of visits to each mobile screen. It gives a clear understanding of how users navigate between different screens and how many exits there are from each screen.
By tracking the users’ behavior on each screen, you can gain profound insights into their activities on a particular screen and refine the navigation pattern of your mobile app accordingly. Furthermore, it helps you to identify problem areas and drop-off screens.
10. Net Promoter Score (NPS) and Customer Satisfaction Score (CSAT)
The NPS (net promoter score) measures customer loyalty and how likely customers are to recommend your product.
In order to calculate your company’s NPS, respondents rate your company between 0 (extremely unlikely) and 10 (very likely), and depending on their response; customers fall into one of three categories:
- Score 9 or 10 for being loyal and enthusiastic customers (Promoters)
- Score 7 or 8 for being happy with your service but not to be considered as promoters (Passives)
- Score 0 to 6 for being unhappy customers who are unlikely to buy from you again (Detractors)

Similar to net promoter score, customer satisfaction score is a metric that can be used to measure customer service and product quality. Customer satisfaction can be measured by asking them to rate their overall satisfaction on a 1 (very unsatisfied) to 5 (very satisfied) scale.
Satisfaction score is important because it helps you to understand how your customers feel about your service or product and identify areas that need improvement.
11. Bounce rate
The bounce rate is the percentage of users who leave your site after viewing only one page.
By monitoring your bounce rate, you can identify areas that need improvement and make changes that will keep visitors engaged.
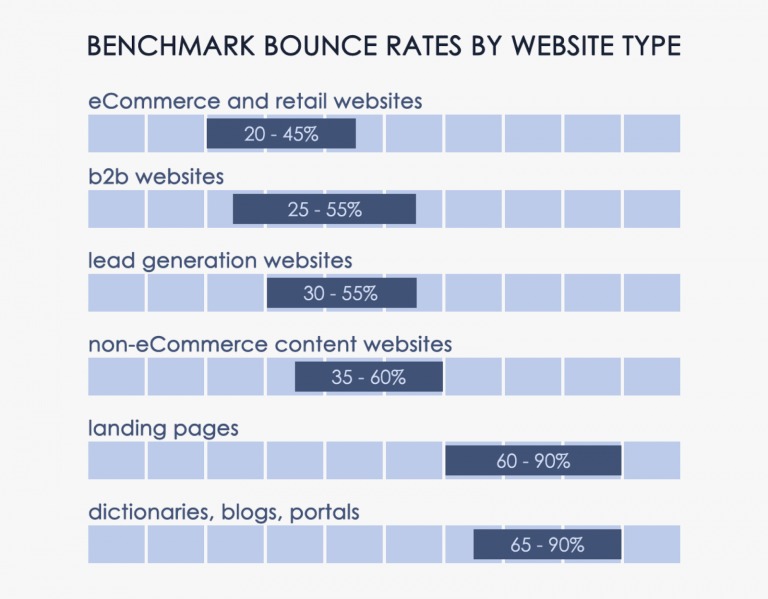
While a certain amount of bounce is to be expected, a high bounce rate can be indicative of problems with the website. For example, if the site is difficult to navigate or if the content is not relevant to the visitor’s needs.
The bounce rate differs depending on the website type:

Metrics can make or break a business
Understanding and tracking the right user engagement metrics is essential for any company that wants to succeed.
Some metrics can be tracked manually, and some crucial metrics, like social engagement, may require using an analytics tool like Oktopost. Oktopost can help you track and analyze social engagement metrics, giving you the insights you need to improve your social media strategy.
With 95% of B2B marketers utilizing social media in some way, it is becoming increasingly important to create a well-executed social media strategy that tracks social engagement data.


